
Strategic Planning Reports
Your application provides a wide range of report types.
Summary Reports ("Summaries")
Summaries present the key results of main optimization steps. Their content is fixed.
You can customize the look of summaries using commands of the context menu available with a right-click.
Your application always displays the summaries for the active project and case study. All summaries are generated and updated automatically.
Note: You cannot delete a summary window.
Settings Reports
Summary settings reports provide records of optimization settings defined in the dialogs. Their content is fixed. You can customize the look of settings reports in the same way as the look of summaries.
The settings reports are generated on-demand with the commands of the Tasks Pane Reports screen's Settings group:
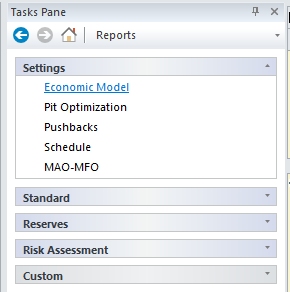
Your application displays the settings reports for the active project and case study. The reports are not automatically updated when modified . You can delete any unwanted settings report windows.
Standard Reports
Standard reports present optimization results in detail. Their content is customizable with a Report Options facility described in a section below. You can customize the look of standard reports in the same way as the look of summaries.
All commands relating to standard reports can be found on the Optimization ribbon's Reports command
group: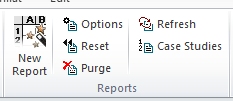
Pit Shells, Pushbacks, Scheduler and Mine Flow Optimization (or Material Allocation Optimizer) reports are generated in two ways:
-
Automatically by the relevant optimization program; displayed in the Latest Report window.
-
On-demand with the commands of the Task Pane Reports screen's Standard group; displayed in their own windows.
An Extraction Sequence report can be generated on-demand for any OES existing in the active case study.
Your application displays the standard reports for the active project and case study. The reports are automatically updated when the relevant optimization is run anew. You can delete any unwanted standard report windows.
Reserves Reports
Reserve reports give bench-by-bench rock mass records for any selected pit, sequence of pits or OES. Their content is customizable with the Report Options facility described below. You can customize the look of standard reports in the same way as the look of summaries.
The reserve reports are generated on-demand with the commands of the Tasks Pane Reports screen's Reserves group. Your application displays the reserve reports for the active project and case study. The reports are not automatically updated when pits are modified. You can delete unwanted reserve report windows.
Grade Curve Reports
Grade curve reports show ore type tonnages classified by grades of mineral elements. You define the content of these reports each time you create them. You can create a grade curve report for any internally generated or imported pit.
Other Reports
The [other report] option allows you to combine existing reports of different types and from different case studies into one spreadsheet. The report window is independent of the active case study and is never automatically updated. You can create any number of “other” reports.
Risk Assessment Reports
Risk assessment reports present results of Geological Risk Analysis (GRA). The content of Input Data, Block Values and OES Evaluation reports is fixed. The Risk Rated Pits report is customizable, just like a standard report.
Report Options
Note: Access these options using Optimization ribbon >> Reports >> Options.
Report options deal with data fields that may vary from one Economic Model to another; therefore, you will be setting the options for the active Economic Model case study.
Studio NPVS report options allow you to customize content of your reports in the following ways:
-
Selection of report items like incremental data, cumulative data, data by pushback, and so on.
-
Selection of data fields (columns) for each report item separately.
-
Defining new data fields with spreadsheet type formulas.
-
Setting the order of data fields.
-
Limiting the number of data rows, requiring for example that only significantly different pit shells be reported.
Your options include:
-
Do nothing, all standard Economic Model data fields will be reported.
-
Define the Standard Report Template only. All standard reports based on this Economic Model (Pit Shells, Pushbacks, Scheduler, Extraction Sequence) use the template.
-
Define different options for some or all standard reports. If, for example, you define Pushbacks Options, they are used by all pushback case studies descending from the active Economic Model case study.
-
The Risk Rated Pits report uses either the Standard Report Template or its own options.
-
Define a Standard Reserve Template. You may also define options for particular reserve reports derived from the active Economic Model.
-
If you create another Economic Model case study, the standard templates will be automatically copied. You should review them if the two models have different data fields.
-
MAO and MFO reports do not depend on Economic Model and do not use the Standard Template. Their option set is quite different and allows you only to choose the report items and exclude selected elements from the items.
See Report Options.
Note: Your application also features general charting functions that can be used to present analysis of any loaded data object. See Charting.
Related topics and activities: